Agile by numbers. Can philosophy be measured?
Hey! It’s KOTELOV!
Agile philosophy claims that collective responsibility guarantees successful development. But how can large business rely on philosophy, make decisions, and see results?
Vlad Lazarev, the leader in Agile transformation at a large bank, was asked how to measure the efficiency of agile implementation and what to do with the figures. We collected metrics that are actually used in practice in this article.

Putting things in order
It is a rare thing to have a single entry point for viewing project reporting, where top management could see all performance indicators and understand whether the company development vector is set correctly even in large companies today. Indeed, it happens even in large companies that top management studies dozens of Excel spreadsheets.
90% of managers of different levels and directions collect their reports manually using extracts from several systems and information into a single report. This takes lots of time.
You can use task managers and service desks to quickly collect reports, but the best solution is BI systems that generate reports from various external systems through queries. In most cases, these are SQL sources: RDBMS, DWH, etc.
Metrics
Agile is not only about philosophy. It offers specific figures that you can rely on when transforming the company. These metrics are available in the Scrum, SAFe, and LeSS frameworks, as well as in the Kanban method.
Let’s review 4 blocks of metrics. They are different for each framework and type of business. First of all, they measure command (process) metrics and Time to Market. We provide definitions below that may seem too academic, but it is important to properly define the essence of processes in Agile.
Time to Market
Time to Market is determined by the organization context. Usually, this is the time from the moment a request is registered in the backlog to its delivery.
The companies with the least T2M (Time to Market) win.
T2M is not a random value: for example, it was 10 months, but we want it to be 3. To understand the value we can reduce it to, we need to decompose processes and find a stage with a delay in implementation. For example, development might go well, but the release build process takes a very long time and the team can’t release it. When the process is set up, it will become clear how much time is released and how much Time to Market can be reduced to.
Y-axis: number of completed works
X-axis: period of time there were developed within

T2M refinement metrics (from Kanban).
Cycle Time is determined by context. It is local time between the two selected development milestones.
Customer Lead Time is lead time for a customer request. It is counted from the point of acceptance of obligations for delivery till the completion of all works on the request.
System Lead Time is counted from the point of acceptance of obligations for delivery to the completion of works by the service team.
Wasted Time is time that the task spends in various queues, not in progress.
Effectiveness is the percentage of time spent directly on working with the task, not on waiting in various queues.
Throughput is the number of tasks that the team can perform per unit of time (day, week, month).
Team metrics (surveys)
Team happiness index. It helps understand the mood of the team so that you can react to it in time and not lose the efficiency of work and employees.
A safe environment for speaking out is needed for people to talk about their mood sincerely and honestly. Surveys should not include management. If a manager wants to participate in the process, be sure that half of the team will definitely not say everything as it is. The promise of anonymity for the interviewees is important.
In real life, companies often track survey participants. This game is not entirely fair but has a positive effect: it removes barriers to free speech while helping companies reach out to people who need support or have problems.
One of the methods is eNPS, a survey conducted once a sprint or once a month. Its idea is to measure the level of the team satisfaction on a ten-point scale. It also cannot be abused, and it is risky to carry out every three months, because you may not be able to react in time.
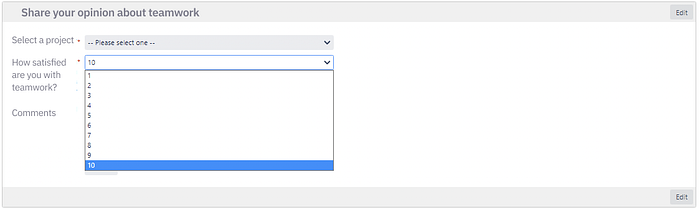
The survey results are summarized in a table displaying the number of detractors (score less than 6 points), neutrals (7–8 points) and promoters (9–10 points). Ratings below 6 highlight problems in the team. If you do not handle them with these members, then they either begin to demotivate the team or quit the company, as a rule.
The results can be discussed in a retrospective meeting or one-on-one with a specific member.
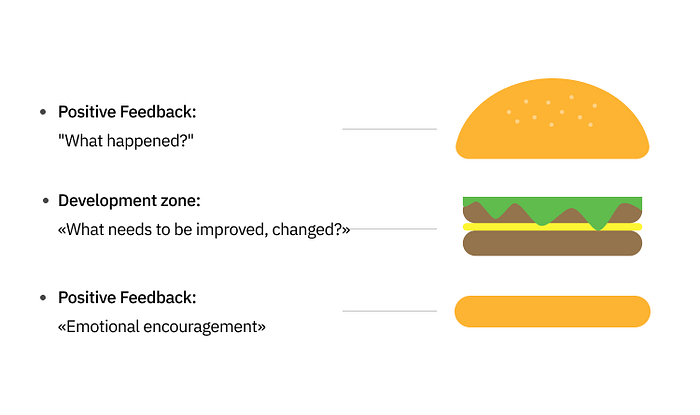
Coaches or resource managers do this in corporations. Feedback techniques, such as the sandwich model, can be used when communicating with team members.
Niko-niko calendar. It is filled out in the context of the sprint on a daily basis. Its idea is to tick one of three emoticons: cheerful, neutral, or sad. The survey is not anonymous, therefore, security is important.
The dynamics helps identify the problems of the team: for example, sometimes the team is happy, but there are weaknesses in the development — this means that most likely there is a problem with trust.
Like in other events such as retrospectives where team members are asked to report issues with internal processes and subjective feelings, self-censorship always comes with risks — for example, when management or teammates accuse team members reporting bad days of “whining”.
This method is not recommended for teams working in constant time pressure, as they will react negatively to the daily filling of the calendar.
Team (process-based) metrics
Process-based metrics demonstrate how your Agile processes established within the team.
When working in sprints, they use the Burndown chart indicator, a task expire chart. Y-axis shows an estimate of the task complexity, and X-axis shows days of the week.
This chart shows the expiration (execution) of work within the sprint. If the chart goes up, then the sprint scope has changed. Inclusion of a new element may mean a breach of agreement or an underloaded team. In perfect world, this should not happen. Changes in the sprint can indicate problems with planning. This chart is generated automatically in Jira.
Velocity chart is a performance diagram, it shows the ratio of planned storypoints to those actually completed. It provides insights into the team predictability over the course of sprints, and how much it fulfills its obligations.
Over time, it displays how many storypoints can be planned for a sprint and helps predict sprint capacity for a team.
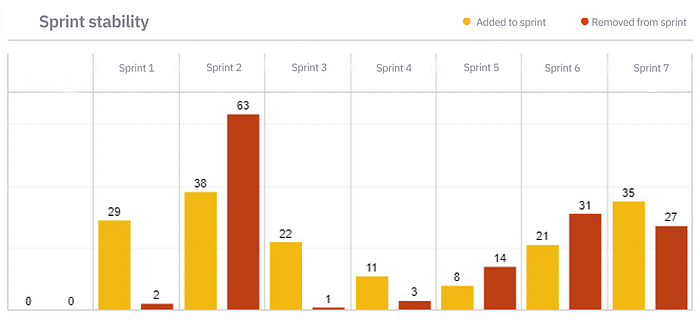
Sprint stability
It indicates whether the scope of work changes within the sprint and primary agreements (sprint goal) are violated.
Work categorization.
It shows which elements are being developed: new functionality or bug fixes, and whether there is tech debt or refactoring.
Vlad Lazarev: There was a case in my practice when a business put pressure on the constant introduction of new features, without devoting time to refactoring. As a result, the servers went down and the organization suffered losses of several hundred million rubles per day.
The team revived the system in 24 hours, spent another 3 months optimizing the code, and reduced the CPU load by only 7% as a result.
The optimal ratio of technical and business tasks in the sprint is as follows:
60% business task (development of new functionality)
20% code refactoring
20% bug fixes in production
Even if the company is not huge, failure to comply with this ratio leads to a decrease in performance and loss of customers, as a result.
Product metrics
Use product metrics to understand if you are developing a useless product. They will show whether the MVP has been completed, whether the development is moving in the right direction, and whether there are end users. It happens in practice that teams develop a product simply because of the existing task, without setting themselves the goal of making a useful product for users.
NSM (north star metric, “polar star” metric) shows the main value of the product for users. It determines the target value prior to product release and measures progress towards the target value during development. If there are no changes within 3–6 months, it can be concluded that the product is developing in the wrong direction. It is recommended to check the metric once a month.
MAU (Monthly Active Users) is the number of unique users per month. It shows whether the system has live users and, as a result, gives an indirect understanding of the MVP completion. It is tracked monthly.
Poor performance on these metrics signal about problems in the product being developed. It is not always possible for a product owner to independently identify a problem and be the first to voice it. It is important for stakeholders to identify deviations from the course in a timely manner.
Devops metrics
You can understand how efficiently the release is developing by looking at the devops indicators.
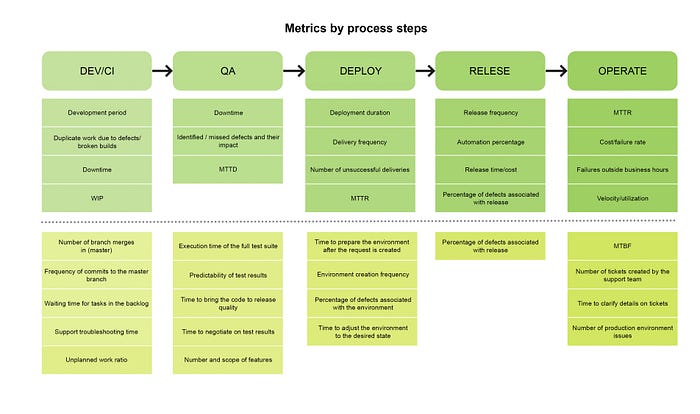
Let’s highlight the most significant metrics:
Delivery frequency. Continuity of deliveries is one of the te
nets in the Agile Manifesto.
The frequency of deliveries determines the number of features delivered to the end user and has a direct impact on the company’s income.
The number of production environment errors as a result of the release. Point errors can happen, and most likely they will, which is acceptable. But if critical and blocking errors occur, which prevent the functionality from operation and block the company’s income, this is a real problem. Why haven’t these errors been detected in the test? The test scenarios could not cover everything. Not everyone has autotests to catch a signal when going through the automated basic scenarios. Not everyone uses unit tests. During the release build process, not all functionality could be sent to production; the error could be missed when merging branches; even after the release, someone else’s functionality could be affected. You need to solve the problem with the highest priority, postponing the product development. Product development will not suffer if you quote work and dedicate 20% of the team’s capacity to handling errors. There will be much more problems if you initially save on correcting errors in time.
Conclusion: Agile is not only about philosophy. There are metrics that help the management of a large business to track the effectiveness of development teams, reduce Time to Market and occupy the top positions in the market. Metrics highlight problem areas or growth areas, they help understand the culture of handling tasks in the task manager and align it, create motivation focus the team on collective responsibility and goal achievement.